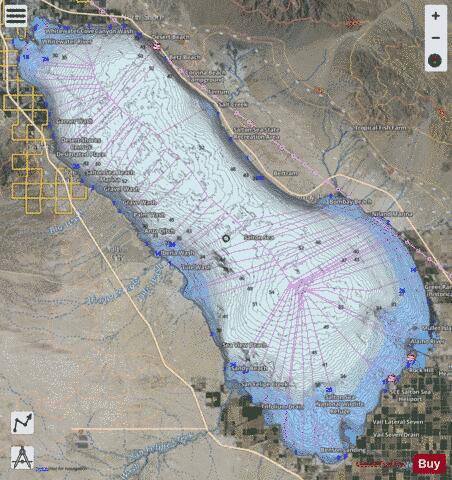
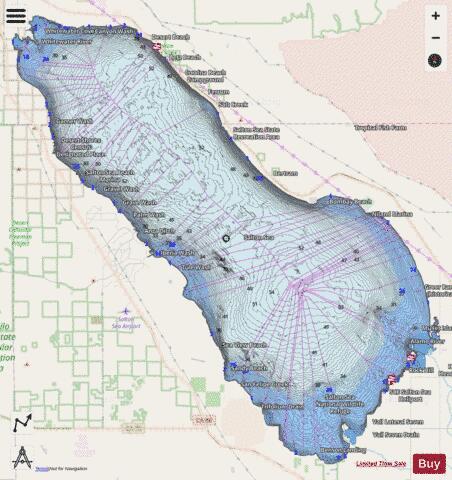
Salton Sea fishing map is available as part of iBoating : USA Marine & Fishing App(now supported on multiple platforms including Android, iPhone/iPad, MacBook, and Windows(tablet and phone)/PC based chartplotter.).
With our Lake Maps App, you get all the great marine chart app features like fishing spots, along with Salton Sea lake depth map. The fishing maps app include HD lake depth contours, along with advanced features found in Fish Finder / Gps Chart Plotter systems, turning your device into a Depth Finder. The Salton Sea Navigation App provides advanced features of a Marine Chartplotter including adjusting water level offset and custom depth shading. Fishing spots and depth contours layers are available in most Lake maps. Lake navigation features include advanced instrumentation to gather wind speed direction, water temperature, water depth, and accurate GPS with AIS receivers(using NMEA over TCP/UDP). Autopilot support can be enabled during ‘Goto WayPoint’ and ‘Route Assistance’.
Now i-Boating supports Fishing Points in Salton Sea.
Have more questions about the Nautical Chart App? Ask us.
Fishing Info for Salton Sea
The Salton Sea is a shallow, landlocked, highly saline body of water in Riverside and Imperial counties at the southern end of the U.S. state of California. It lies on the San Andreas Fault within the Salton Trough that stretches to the Gulf of California in Mexico. Over millions of years, the Colorado River has flowed into the Imperial Valley and deposited alluvium (soil), creating fertile farmland, building up the terrain, and constantly moving its main course and river delta. For thousands of years, the river has alternately flowed into the valley, or diverted around it, creating either a saline lake called Lake Cahuilla, or a dry desert basin, respectively. When the Colorado River flows into the valley, the lake level depends on river flows and the balance between inflow and evaporative loss. When the river diverts around the valley, the lake dries completely, as it did around 1580. Hundreds of archaeological sites have been found in this region, indicating possibly long-term Native American villages and temporary camps. The current lake was formed from an inflow of water from the Colorado River in 1905. Beginning in 1900, an irrigation canal was dug from the Colorado River to the old Alamo River channel to provide water to the Imperial Valley for farming. The headgates and canals sustained a buildup of silt, so a series of cuts were made in the bank of the Colorado River to further increase the water flow. Water from spring floods broke through a canal head-gate diverting a portion of the river flow into the Salton Basin for two years before repairs were completed. The water in the formerly dry lake bed created the modern lake, which is about 15 by 35 miles (24 by 56 km). The lake would have dried up, but farmers used generous amounts of Colorado River water and let the excess flow into the lake. In the 1950s and into the '60s, the area became a resort destination, and communities grew with hotels and vacation homes. Birdwatching was also popular as the wetlands were a major resting stop on the Pacific Flyway. In the 1970s, scientists issued warnings that the lake would continue to shrink and become more inhospitable to wildlife. In the 1980s, contamination from farm runoff promoted the outbreak and spread of diseases. Massive die-offs of the avian populations have occurred, especially after the loss of several species of fish on which they depend. Salinity rose so high that large fish kills occurred, often blighting the beaches of the sea with their carcasses. Tourism was drastically reduced. After 1999, the lake began to shrink as local agriculture used the water more efficiently so less runoff flowed into the lake. As the lake bed became exposed, the winds sent clouds of toxic dust into nearby communities. Smaller amounts of dust reached into the Los Angeles area and people there could sometimes smell an odor coming from the lake. The state is mainly responsible for fixing the problems, and California lawmakers pledged to fund air-quality management projects in conjunction with the signing of the 2003 agreement to send more water to coastal cities. Local, state, and federal bodies all had found minimal success dealing with the dust, dying wildlife, and other problems for which warnings had been issued decades before. At the beginning of 2018 local agencies declared an emergency and, along with the state, funded and developed the Salton Sea Management Program. In 2020, Palm Springs Life magazine summarized the ecological situation as "Salton Sea derives its fame as the biggest environmental disaster in California history". After a slow start and some small projects, construction started on a $206.5 million project in early 2021 on the delta of the New River, creating ponds and wetlands on the southern shore of the lake.
More on Wikipedia...Popular fish species in this lake include Anisotremus, Bonytail chub, Cynoscion, Largemouth bass, Micropogonias, Mosquitofish, Mozambique tilapia, Oreochromis urolepis hornorum, Razorback sucker, Sailfin molly and Threadfin shad.
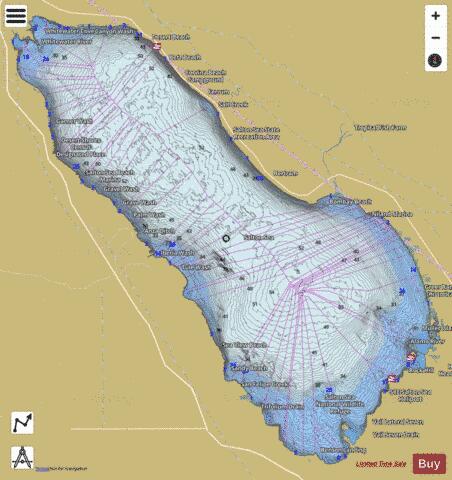
Salton Sea Fishing Map Stats | |
| Title | Salton Sea |
| Scale | 1:24000 |
| Counties | Imperial, Riverside |
| Nearby Cities | Salton Sea Beach, Bombay Beach, Desert Shores, North Shore, Oasis, Salton City, Mecca, Niland, Westmorland, Calipatria |
| Area * | 234509.44 acres |
| Shoreline * | 151.38 miles |
| Min Longitude | -116.09 |
| Min Latitude | 33.09 |
| Max Longitude | -115.58 |
| Max Latitude | 33.53 |
| Edition Label 1 | |
| Edition Label 2 | |
| Edition Label 3 | |
| Id | US_CA_00248771 |
| Country | US |
| Projection | Mercator |
| * some Stats may include nearby/connecting waterbodies | |
|